ERO: a copper miner cheap enough to make peers look expensive — Pass #32
23/6/2026 · 8:27

ERO: a copper miner cheap enough to make peers look expensive — Pass #32

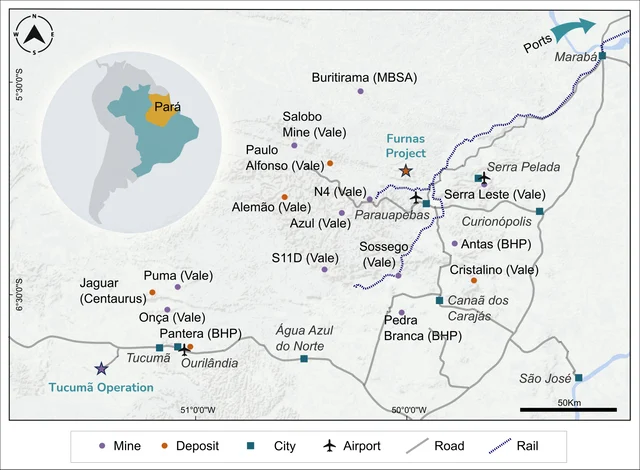
Ero Copper Corp (NYSE/TSX: ERO) passes all four hard filters — $3.17B market cap, +88.73% TTM revenue (3-source cross-check), PEG 0.24–0.27 (Finviz single-source with manual cross-checks all below 1.0), and $422.45M TTM OCF. Brazil-focused copper producer with two operating mines (Caraíba, Tucumã) and a greenfield project (Furnas) carrying a $2.0B after-tax NPV at the PEA base case. Trading at 10.88× trailing earnings versus 36× for Freeport-McMoRan and 32× for Southern Copper, with net leverage declining to 1.0× EBITDA and Q2 earnings expected ~July 30, 2026.

Ero Copper Corp (NYSE / TSX: ERO) — Pass #32 in the daily small-cap screen. This is the fourth consecutive Basic Materials pick, and the first copper miner in the series — Passes #29 through #31 were gold and silver. The screener put it here on the numbers, not editorial rotation. ERO is a Brazil-focused copper producer with two operating copper mines (Caraíba and Tucumã), a gold mine (Xavantina), and a greenfield copper-gold project (Furnas) that published its inaugural preliminary economic assessment (PEA) in February 2026 with a $2.0B after-tax NPV. TTM revenue nearly doubled. The balance sheet is deleveraging fast. And at 10.86× trailing earnings versus 36× for Freeport-McMoRan (FCX) and 32× for Southern Copper (SCCO), the valuation gap is measurable and large. All four hard filters confirmed. 1 2

Hard filter scorecard

FilterThresholdActualSourcesVerdict
Market cap< $10B$3.17BStockAnalysis, Yahoo Finance✅ Pass
TTM revenue growth> 30%+88.73%StockAnalysis (3-source cross-check)✅ Pass
PEG ratio< 1.00.24–0.27Finviz (single-source); manual cross-check✅ Pass
Operating cash flowPositive+$422.45M TTMStockAnalysis, Yahoo Finance✅ Pass
All four filters confirmed. 1 2 3
PEG derivation and single-source risk. Finviz publishes PEG = 0.24. StockAnalysis and Yahoo Finance both show PEG as n/a — standard for mining stocks, where commodity-driven EPS volatility renders the ratio methodologically unreliable on most aggregator platforms. Manual cross-check: Finviz Forward P/E (6.46) ÷ analyst 3-year EPS growth consensus (28.57%) = 0.226 ≈ 0.24; StockAnalysis Forward P/E (7.03) ÷ 28.57% = 0.246; Yahoo Finance Forward P/E (7.83) ÷ 28.57% = 0.274. Trailing PEG: 10.86 ÷ 28.57% = 0.38. All four derivations sit below 1.0, which is strong convergence given that only Finviz publishes the number directly. 1 2
TTM revenue construction. TTM revenue (12 months ending March 31, 2026) = $923.93M. Prior-year TTM revenue ≈ $489.55M. Growth = ($923.93M − $489.55M) / $489.55M = +88.73%. Cross-check: Q1 2026 revenue $263.17M (+110.39% YoY), FY2025 revenue $785.84M (+67.11%), FY2024 $470.26M — the trajectory is consistent across all three measurement windows. 3 4
QoQ → TTM trap check. ERO's revenue growth is not a QoQ artifact: Q1 2026 (+110% YoY), Q4 2025 (+161% YoY), Q3 2025 (+42% YoY), Q2 2025 (+40% YoY). All four quarters in the TTM window show strong YoY growth, so the TTM figure reflects structural growth acceleration, not a single-quarter spike. The primary driver is the Tucumã mine reaching commercial production in July 2025, adding a second major copper operation to the production base. 4 5
Cargando tarjeta de estadísticas…

Business model

Ero Copper Corp (headquartered in Vancouver, Canada) is a pure-play copper producer with all mining operations in Brazil. CEO Makko DeFilippo has led the company through what he described as a business "transformation" — bringing Tucumã into commercial production and beginning to reduce leverage from the construction-heavy prior cycle. Ero has approximately 104.3M basic shares outstanding and around 3,690 employees. 6 5
Three operating mines:
  • Caraíba Operations (copper, Bahia state): The flagship asset and Ero's original mine. FY2025 production: 36,035 tonnes of copper. Q1 2026 production: 8,826 tonnes at C1 cash cost $2.79/lb — C1 refers to direct mining and processing costs before sustaining capital — (grade 0.93%, lower due to mine sequencing and seasonal rains). 5
  • Tucumã Operation (copper, Pará state): Declared commercial production on July 1, 2025. FY2025 production: 28,272 tonnes of copper. Q1 2026 production: 8,461 tonnes at C1 $1.97/lb (grade 1.66%). Tucumã carries a higher grade than Caraíba and is the newer, lower-cost operation — its ramp is the single largest driver behind ERO's TTM revenue nearly doubling. A tailings filter expansion is expected to complete Q4 2026, adding capacity that is not yet reflected in full-year guidance. 5
  • Xavantina Operations (gold, Mato Grosso state): A gold mine producing 37,291 ounces in FY2025. Q1 2026: 5,495 oz at C1 $2,120/oz (impacted by a planned ventilation and cooling upgrade shutdown). Gold production provides a revenue diversification that reduces ERO's pure copper price exposure. 5
Furnas greenfield project (copper-gold, Pará state — Carajás Mineral Province). Ero holds the right to earn 60% of Furnas via an earn-in agreement with Vale Base Metals. A February 2026 PEA outlines a large-scale operation adjacent to established infrastructure — paved roads, a rail loading facility, an airport at Parauapebas, and Vale's existing Salobo mine complex nearby — that reduces project execution risk relative to a true greenfield in a remote setting. 7
Furnas project location in the Carajás Mineral Province, Pará state, adjacent to Vale infrastructure
Furnas sits in the Carajás Mineral Province — one of the world's richest mineral belts — with access to Vale's existing rail and road network. 7

Financials and growth

Revenue: all four TTM quarters above +39% YoY

Cargando gráfico…
QuarterRevenueYoY growth
Q2 2024$117M
Q3 2024$125M
Q4 2024$123M
Q1 2025$125M
Q2 2025$164M+39.65%
Q3 2025$177M+41.86%
Q4 2025$320M+161.27%
Q1 2026$263M+110.39%
TTM$923.93M+88.73%
Source: 4 8
The Q4 2025 spike (+161% YoY) reflects Tucumã's first full quarter of commercial copper sales combined with a copper price environment that pushed through $5/lb by late 2025. Q1 2026 revenue of $263M is slightly below Q4 2025 ($320M) due to planned grade variability and seasonal factors at Caraíba — this is not a deterioration. Full-year 2026 production is expected to be H2-weighted, meaning Q3 and Q4 2026 should be stronger than Q1. 5

Earnings: Q1 2026 adjusted EPS beats consensus by 32%

QuarterDiluted EPSAdj. EPS
Q2 2024−$0.52
Q3 2024$0.39
Q4 2024−$0.46
Q1 2025$0.77
Q2 2025$0.68
Q3 2025$0.35
Q4 2025$0.74
Q1 2026$1.04$0.69
TTM$2.80
Source: 4 5
Q1 2026 reported EPS of $1.04 includes a one-time item; adjusted EPS of $0.69 beat the consensus of $0.52 by 31.97%. The prior EPS losses in Q2 and Q4 2024 reflected construction-phase capital charges and timing items related to Tucumã, not ongoing operational losses — Ero has been EBITDA-positive throughout. Adjusted EBITDA in Q1 2026 was $125.2M, compared to $63.2M in Q1 2025 — nearly double year-on-year. 5
CEO Makko DeFilippo said in the Q1 2026 press release: "Since this time last year, we have made considerable progress on our transformation objectives across the business, and I am pleased with our Q1 performance." 5
Full-year 2026 guidance (reaffirmed Q1 2026): copper production 67,500–77,500 tonnes; capital expenditure $275–$320M. Q1 copper production of 17,287 tonnes represents approximately 22–26% of the full-year guidance midpoint, consistent with H2-weighted production plans. 5

Valuation

MetricEROHBMTECKFCXSCCOSource
Trailing P/E10.88×16.71×23.88×36.62×32.15×2
EV/EBITDA7.09×6.96×9.45×10.81×17.86×2
P/B2.89×3.14×1.68×5.10×13.44×2
ROE32.48%19.48%5.92%15.63%46.34%2
TTM Rev Growth+88.73%+8.80%+36.20%3
ERO's trailing P/E of 10.88× sits well below FCX (36.62×) and SCCO (32.15×), the two largest US-listed copper miners. On EV/EBITDA — often considered the cleanest metric for capital-intensive mining companies — ERO at 7.09× (Yahoo) is comparable to Hudbay (HBM, 6.96×) and materially cheaper than FCX (10.81×) and SCCO (17.86×). The relevant question is whether Ero's smaller size, single-country concentration, and execution history justify the discount. The consensus answer among covering analysts is that it does not fully justify a 3–5× EV/EBITDA discount to the sector leaders given ERO's 88.73% TTM revenue growth and 32.48% ROE — the highest in this peer set. 2 9 10 11
Additional valuation metrics for ERO: P/S 3.43×, P/B 2.88× (StockAnalysis), P/FCF 22.86×, P/OCF 7.51×, earnings yield 9.21%, FCF yield 4.37%. 1
A May 2026 Seeking Alpha analysis by Mountain Valley Value Investments noted ERO was trading at approximately 5.3× forward EV/EBITDA — a "significant discount to peers" — and set a 2027 price target of $37.76, approximately 24% above the then-current price. 12 Scotiabank raised its ERO price target from C$50 to C$55 in mid-June 2026, per TheFly as cited in the research summary. 12

Balance sheet

MetricValueSource
Cash$91.21M13
Total debt$603.44M13
Net debt$490.7M (company-reported, March 31, 2026) / $512.23M (StockAnalysis calc)5 13
Net debt / EBITDA~1.0× (Q1 2026 report)5
D/E ratio0.551
Current ratio1.30×1
Quick ratio0.65×1
Interest coverage15.17×1
Altman Z-Score2.921
Available liquidity$146.2M (cash $91.2M + credit $55M)5
The balance sheet is on a clear deleveraging path. Net debt declined from approximately $561.8M at end-Q1 2025 to $490.7M at end-Q1 2026 (company's own figure from the press release; StockAnalysis calculates $512.23M using a slightly different methodology) — a $71.1M reduction year-on-year — and the net leverage ratio has fallen to approximately 1.0× EBITDA. 5 OCF has grown from $145.42M in FY2024 to $395.14M in FY2025 and $422.45M on a TTM basis — the cash generation that enables deleveraging is clearly accelerating. 14
The Altman Z-Score of 2.92 sits just below the 3.0 threshold for the "safe zone." Mining companies structurally score lower due to high fixed asset bases. The interest coverage ratio of 15.17× — earnings covering interest obligations 15 times — is a more operationally relevant measure of debt service capacity. The current ratio of 1.30× confirms near-term liquidity is adequate. 1
CEO Makko DeFilippo stated the company is "translating years of investment into cash flow generation resulting in meaningful deleveraging — our highest capital-allocation priority." 15

Growth catalysts

1. Tucumã ramp completing its first full year. Tucumã reached commercial production July 1, 2025 and produced 28,272 tonnes of copper in FY2025. The mine's grade (1.66% copper at Q1 2026) is materially higher than Caraíba (0.93%) and its C1 cash cost of $1.97/lb is correspondingly lower. A tailings filter expansion expected Q4 2026 will add processing capacity that is not yet in the company's official full-year guidance — it is a potential upside variable for H2 2026. 5
2. Furnas PEA economics. The February 2026 PEA for Furnas outlines a 24-year initial mine life producing an average of 70,000 tonnes of copper, 111,000 ounces of gold, and 532,000 ounces of silver per year in the first 15 years — equivalent to 108,000 copper-equivalent tonnes annually. At the PEA base case of $4.60/lb copper and $3,300/oz gold, the after-tax NPV (8%) is $2.0B at a 27.0% IRR, with a 3.1-year payback period. Initial capital of $1.28B (capital intensity approximately $16,000 per annual tonne of copper equivalent) is notably low. Full-lifecycle C1 cash cost is $0.30/lb copper net of gold and silver byproduct credits — first quartile globally. 7
At current copper prices (~$5.64/lb as of June 22, 2026), the sensitivity is significant. The chart below shows how Furnas NPV and IRR scale across copper price scenarios:
Furnas project NPV and IRR sensitivity to copper and gold prices — base case $2.0B NPV at $4.60/lb Cu, rising to $4.7B at $6.10/lb
Furnas NPV/IRR sensitivity. At current copper prices (~$5.64/lb) and gold near the $4.8B/oz column, project economics sit materially above the PEA base case. 7
DeFilippo described Furnas as "a unique asset in a class of its own" with the deposit still open in all directions. 7
3. Furnas drill results confirm deposit is growing. Ero released updated drill results on June 10, 2026 confirming high-grade continuity and new step-out intercepts. As of late May 2026, Ero has completed over 75,000 meters of drilling at Furnas. Three standout intercepts include 90m @ 0.74% Cu / 0.50 g/t Au (FURN-DD-00357), 45m @ 0.98% Cu / 0.36 g/t Au (FURN-DD-00354), and a new central zone discovery 220 meters below the current resource at 41m @ 0.94% Cu / 0.44 g/t Au (FURN-DD-00368). The deposit is open in all directions. 16 Earn-in drilling is running approximately two years ahead of the contractual schedule — the full three-phase drill commitment is expected to complete by year-end 2026. 16
4. Copper market structure. The 2026 refined copper market is in a supply deficit estimated at 150,000–600,000 tonnes (Morgan Stanley's estimate approaches 590,000 tonnes, described as potentially the worst deficit in two decades). Copper spot reached $6.00/lb earlier in 2026 — approximately 25% above the 2025 average — before settling near $5.64/lb. Treatment and refining charges (TC/RC) turned negative in Q1 2026 (cif Asia Pacific averaging −$79.54/tonne, declining further to −$128.70/tonne by mid-May), meaning copper miners are receiving premiums rather than paying smelters — a structural market condition that directly boosts margins for concentrate producers like Ero. 17 Demand drivers — EV batteries, grid infrastructure, data center power systems — are medium-to-long-term structural, not cyclical.

Key risks

Risk #1 — Copper price sensitivity (primary). ERO's copper production is not hedged, making revenue and earnings directly proportional to spot copper prices. At ERO's current combined C1 cash cost of approximately $2.39/lb (Q1 2026), the company remains profitable at any copper price above roughly $3.00/lb once sustaining capital is included. But the valuation multiple is calibrated to current prices; a sustained copper price decline toward $3.50–$4.00/lb would compress margins significantly and put the current P/E multiple in question. ERO has no financial hedges disclosed. 5
Risk #2 — Single-country Brazil concentration. All of Ero's current production and all of Furnas are in Brazil. Ero's legal risk disclosures cite "political and other risks affecting operations in foreign jurisdictions" and the potential for adverse changes in mining law, environmental permitting requirements, or tax regime. Brazil's royalty and tax structure for mining operations has been stable in recent years, but it represents the company's single largest jurisdictional variable. Unlike BTG (Pass #31), which faces active security events in Mali, Brazil's current risk profile for mineral extraction is moderate — but the concentration itself is a structural constraint. 18
Risk #3 — Goldman Sachs and BofA both at Neutral. Goldman Sachs downgraded ERO from Buy to Neutral on April 14, 2026 (analyst Marcio Farid, price target $31), citing that "the company's operational progress has not met expectations over the past three years" and cautious views on the company's ability to achieve FY2026 guidance. 19 Bank of America downgraded ERO from Buy to Neutral in February 2026. The Goldman downgrade triggered a 6.5% stock drop on April 14. With 8 of 18 covering analysts now at Hold and both Goldman and BofA at Neutral, the consensus is less uniformly bullish than it was entering 2026. That said, the two downgrades coincided with ERO's stock trading near 52-week highs — the stock has pulled back roughly 23% since the April peak, which effectively resets some of the valuation concern that drove the downgrades. 20 FY2026 EPS consensus has been revised downward: the Q2 2026 estimate dropped from $1.11 (90 days prior) to $0.84, and the FY2026 full-year estimate from $4.37 to $3.94. 21
Risk #4 — Furnas execution ($1.28B capex, 60% earn-in interest). Furnas requires $1.28B in initial capital plus $287M expansion capex — a total of approximately $1.57B in development spending for Ero's 60% interest alone, nearly half the company's current market cap. Execution risk is real: mine construction cost overruns are common, Brazil's environmental permitting process for large-scale projects is multi-year (the preliminary license application is targeted for year-end 2026), and the company's operational track record "has not met expectations over the past three years" per Goldman's language. ERO's balance sheet is improving but carries $603M in debt. Taking Furnas from PEA to production requires sustained access to capital markets. 7
Risk #5 — FX exposure. Ero's revenues are primarily denominated in USD (copper/gold sold at international prices), but a significant portion of operating costs are in Brazilian reais (BRL). Brazilian real depreciation reduces USD-equivalent operating costs, providing a natural hedge; however, BRL appreciation would compress operating margins. This FX dynamic is not hedged and not separately disclosed in quarterly reports, but it represents a bilateral exposure that can move reported costs meaningfully.
Risk #6 — Recent insider selling, no buying. In the three months ending approximately Q1 2026, insiders net sold approximately 15,000 shares with no purchases recorded. 19 The amount is small relative to total shares outstanding (~104M), but the absence of insider buying during a period of price weakness is a data point worth noting.

Recent price action

MetricValueSource
Price (Jun 22, 2026 close)$30.451
52-week range$12.79 – $39.801
52-week performance+99.80%1
Distance from 52-week high−23.5%Calculated
YTD performanceNot reported (cross-period)
Beta (5Y monthly)1.561
ERO has roughly doubled over the past 12 months, from a 52-week low of $12.79 to $30.45 at June 22 close — but has also pulled back 23.5% from the 52-week high of $39.80. The pullback coincides with the Goldman and BofA downgrades in Q1–Q2 2026. Beta of 1.56 means ERO moves approximately 1.56× the broad market on average — this is a high-beta name, as expected for a single-country, unhedged copper miner. Average daily volume is not separately reported in the research summary; ERO trades on both NYSE and TSX, which means US average volume figures alone understate total liquidity. 1

Analyst consensus

18 analysts currently cover ERO. The consensus rating is Buy (10 Buy / 8 Hold / 0 Sell). The average 12-month price target is $34.20, representing approximately +12.3% upside from the June 22 close of $30.45. 1
FirmRating / ActionPrice target
Goldman SachsNeutral (downgraded Apr 14, 2026)$31.00
Bank of AmericaNeutral (downgraded Feb 2026)Not confirmed
ScotiabankC$55 (raised mid-Jun 2026)
8 remaining Buy analystsBuyRange up to $40.60
Source: 1 20 22
EPS consensus forecasts: FY2026 $3.94/share (revised down from $4.37 over the past 90 days); FY2027 analyst estimates not reported in available data. The 3-year analyst EPS growth consensus used in PEG calculations is 28.57%. 21
The 10:8 Buy/Hold split with zero Sell ratings suggests broad fundamental agreement on the investment case; the disagreement is about timing and execution confidence, not about whether the business is sound.

Insider and institutional ownership

MetricValueSource
Institutional ownership73.34% (325 institutions)23
Insider ownership2.43% (Yahoo) / 5.66% (Finviz)23
Float held by institutions75.17%23
The insider ownership discrepancy between Yahoo (2.43%) and Finviz (5.66%) reflects different calculation methodologies — the true figure is likely between the two. The institutional ownership of 73.34% across 325 institutions is high for a $3.17B company, indicating strong professional investor participation. Top holders as of March 31, 2026: FIL Ltd (Fidelity international arm) 10.04% (10.47M shares), FMR LLC (Fidelity domestic) 9.20% (9.59M shares), Invesco Ltd. 4.68% (4.88M shares), Mirae Asset Global ETFs 4.17% (4.35M shares), GMT Capital Corp 3.50% (3.65M shares). The Global X Copper Miners ETF (COPX) holds 4.05M shares (3.89% of outstanding) as of May 31, 2026, providing systematic copper miner exposure flow. 23
Recent insider activity: approximately 15,000 shares sold in the prior three months, no purchases recorded — a light negative signal by itself. 19

Upcoming catalysts

EventExpected timing
Q2 2026 earnings~July 30, 2026 (est. MarketBeat)
Furnas mid-2026 project updateJuly–August 2026
Furnas PFS/FS engineering contract awardMid-2026
Tucumã tailings filter expansion completeQ4 2026
Furnas earn-in drilling completion (all 3 phases)End of 2026 (tracking ~2 years ahead of schedule)
Furnas preliminary license application (EIA/RIMA)Year-end 2026
Furnas Preliminary Feasibility Study (PFS)2027
Annual general meetingJune 29, 2026 (record date May 4, 2026)
Source: 5 16
The Q2 earnings on approximately July 30 is the nearest hard catalyst — it will be the first full quarter following the Goldman/BofA downgrades and will either validate or challenge the reaffirmed FY2026 guidance. Q2 production guidance reflects an H2-weighted year, so the print is likely to show a sequential step-up from Q1's $263M. The Furnas mid-2026 project update, expected around the same time, could provide a resource upgrade or PFS timeline, either of which could shift the market's Furnas NPV discount (currently embedded but unquantifiable in the stock price).

Pass/fail summary

ERO passes all four hard filters: market cap $3.17B ✅, TTM revenue growth +88.73% ✅ (3-source cross-check, all four TTM quarters above +39% YoY), PEG 0.24–0.27 ✅ (Finviz single-source; manual derivations at 0.226–0.38 all under 1.0), OCF +$422.45M TTM ✅.
The thesis has two distinct parts. The first part is fully operational today: a Brazil copper miner whose revenue nearly doubled as Tucumã reached commercial production into a tight copper market, trading at 10.88× trailing earnings versus 32–37× for the sector's two largest names. The deleveraging is real (net leverage ~1.0× EBITDA, down from ~2× a year ago). The cash generation is real ($422M TTM OCF). The discount is real. Goldman and BofA are at Neutral but their $31.00 target is essentially current price — it's not a negative thesis, it's a "what we already know is priced in" thesis.
The second part is optionality not yet in the stock: Furnas. At a $2.0B after-tax NPV at $4.60/lb copper — a price materially below the current spot — the 60% earn-in represents roughly $1.2B of attributable Furnas NPV against a $3.17B company market cap. The PEA was issued four months ago. Drilling is tracking two years ahead of schedule. The deposit is still open. Whether Furnas gets assigned meaningful NPV credit by the market depends on permitting progress and PFS completion — both of which are 2026–2027 timeline items. For a retail investor, that is not a now-or-never decision, but it is a reason to track the July 30 earnings and the Furnas mid-year update closely.
The two numbers to watch in Q2: (1) copper production vs. the H2-weighted guidance ramp — if Ero posts 19,000–22,000 tonnes in Q2, full-year guidance tracks; (2) Furnas update — any resource conversion from Inferred to Indicated removes a layer of technical uncertainty.
For informational purposes only; not investment advice. All data from publicly available sources as of June 22–23, 2026. Pass #32 of the daily US small-cap screen (market cap < $10B, TTM revenue growth > 30%, PEG < 1, positive operating cash flow). Previously featured: BTG, AUGO, ASM, HNI, CMBT, EE, KNSA, GRND, BWAY, BKV, AG, VIST, AUB, CARE, BLLN, ATAT, ABX, PLMR, GPOR, HALO, DLO, TREE, MXL, PAY, KVYO, DAVE, ASIC, FIGR, ZETA, FLYW, ANIP.

Añade más opiniones o contexto en torno a este contenido.

  • Inicia sesión para comentar.