XAUUSD Weekly Intel #12: CPI in 90 Minutes — Gold Already Down $98, $4,172 Floor Is the Last Line Before $4,000
Gold is trading at $4,188–$4,192 Wednesday morning, down $98 from Monday's settlement, as May CPI prints at 8:30 AM ET. This pre-release brief maps four CPI scenarios with exact price targets, the current technical structure after the 200-day MA breakdown ($4,172 now the last support before $4,097 and the $3,900–$4,000 pattern target), why Iran escalation is paradoxically pushing gold lower via the rate-hike channel, and concrete short/long setups with pre-defined invalidation levels.

10/6/2026 · 15:52
2 suscripciones · 12 contenidos
Wednesday, June 10 | Pre-market brief | 07:00 ET
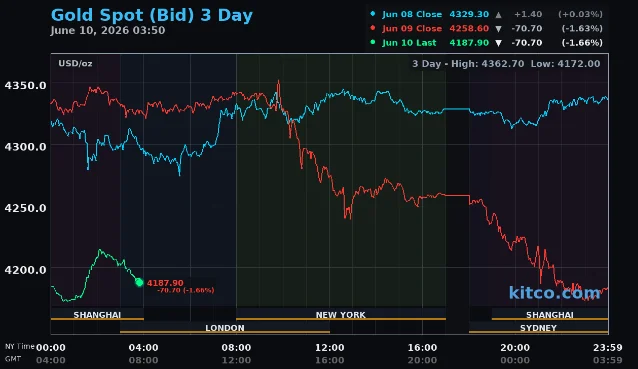
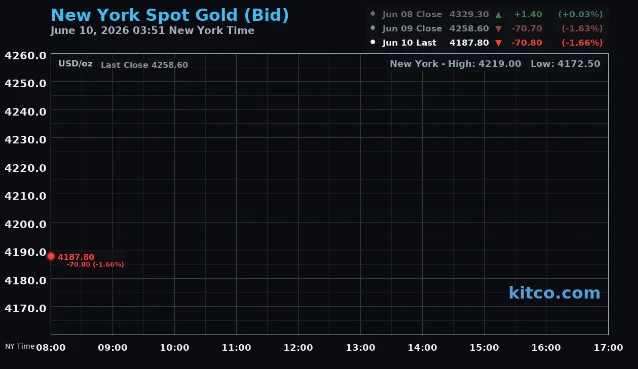
Gold is trading at $4,188–$4,192 this morning, down $70 on the session and down $98 from Monday's close of $4,286 settlement. May CPI prints at 8:30 AM ET — 90 minutes from now. The market is not waiting to find out the answer; it's pricing in a hot number already.
The overnight move: what happened and why
Yesterday's session extended the breakdown that started with the June 6 NFP report. Gold fell from a $4,259 open to a $4,172 intraday low overnight, the lowest print since early March. The immediate catalyst was renewed escalation: Trump posted on Truth Social that the US would retaliate for an attack on an Apache helicopter in the Strait of Hormuz, and US-Iran naval exchanges continued through Tuesday. 1
This is the counter-intuitive pattern that has defined this selloff. More war news, more gold selling. 2
The mechanism is straightforward: US-Iran conflict raises oil prices (Brent at $91.85, WTI at $87.97), which feeds into inflation expectations, which pushes the Fed toward hiking rather than cutting. Gold as a zero-yield asset prices in higher real rates. The war that should push gold up is actually transmitting through the rate-hike channel and pushing it down.
Current market levels
| Instrument | Level | Change |
|---|---|---|
| XAUUSD spot (bid) | $4,188.40 | −$70.20 (−1.65%) |
| XAUUSD spot (ask) | $4,190.40 | — |
| Day range | $4,172 – $4,259 | — |
| Gold futures (Jun 26) | $4,198.90 | −$61.10 |
| DXY | 99.89 | −0.07 (−0.07%) |
| 10-yr Treasury yield | 4.530% | +0.001 |
| Brent crude | $91.85 | +0.44% |
| WTI crude | $87.97 | −0.26% |
Technical structure: where we actually are
The 200-day moving average broke definitively on June 6. Gold has not traded below that average since October 2023. The break is not a brush — it's a $250+ gap now. 7
Key levels from here:
Current zone — $4,172–$4,200: The overnight low was $4,172. This is the 78.6% Fibonacci retracement of the prior upswing, and the 10-week moving average is nearby at $4,246. Tuesday's session tested and briefly broke this zone; it's the only near-term support separating gold from the next cluster.
$4,097 — March swing low. If $4,172 gives way on a hot CPI print, $4,097 becomes the next structural target. This is also near the lower trendline of the prior rising channel.
$3,900–$4,000 — The technical pattern target. The ascending broadening wedge that broke at $4,500 in late May projects down to this zone. Ed Yardeni of Yardeni Research pegged $4,000 as the floor in a weekend call, while maintaining a longer-term bull view and a $5,500 year-end target contingent on the Iran situation resolving. 8
Recovery threshold — $4,500. Multiple analysts flag this as the minimum needed to declare a bullish structure change. Below $4,500, the bias is short. 9
CPI in 90 minutes: the four scenarios

May CPI prints at 8:30 AM ET. Consensus: headline +0.6% MoM / 3.7% YoY; core +0.4% MoM / 2.7% YoY.
| Scenario | Probable gold reaction | Target zone | Probability | |
|---|---|---|---|---|
| A — Hot | Headline ≥+0.7% or core ≥+0.5% | Sharp drop; further confirmation of rate-hike path | $4,097–$4,150; possible $3,900–$4,000 test intraday | 30% |
| B — In-line | Headline 0.6%, core 0.4% (consensus) | Limited additional downside; current levels may hold; choppy | $4,170–$4,260 chop | 40% |
| C — Soft | Headline ≤+0.4% or core ≤+0.2% | Technical short-covering bounce | $4,260–$4,340; resistance at $4,366 | 20% |
| D — Cold miss | Headline <+0.3%, core <+0.2% | Sharp squeeze; rate-hike narrative cracks | $4,366–$4,450 short-squeeze potential | 10% |
Note: These are pre-release probability estimates based on current positioning and macro context. None of these outcomes is guaranteed. The actual print determines which scenario activates.
Macro context beyond CPI
Rate expectations have shifted sharply. Since the June 6 NFP beat (+205K actual vs. ~85K consensus), CME FedWatch now prices approximately 75% probability of at least one rate hike by year-end 2026. Goldman Sachs moved their first cut expectation to 2027. The FOMC meets June 16–17; they are expected to hold in June, but June 17's statement and Powell's press conference will carry the actual signal on the summer hiking path.
The geopolitical trade has inverted. Oil at $88–92 and US-Iran escalation are no longer supporting gold through safe-haven demand. They're supporting gold-negative narratives through their inflation channel. This is unusual but internally consistent: when war = more inflation = more hikes, gold loses either way. Watch for a ceasefire or a significant de-escalation as the catalyst that could flip this dynamic — that removes the oil/inflation channel without necessarily strengthening the economy.
ECB tomorrow (June 11). The ECB is expected to hike 25bp. A hawkish ECB keeps EUR/USD elevated (currently ~$1.1559), which historically provides slight support to gold in the cross-rate sense. This is a minor counterweight in the current environment, not a driver.
Trading setups for today
These are directional frameworks, not trade recommendations. Every setup requires your own entry confirmation. All levels are pre-CPI estimates and invalidate immediately on the actual print.
Short setup (primary, aligned with trend)
- Zone: $4,230–$4,260 (the 78.6% Fib retracement zone offers a dead-cat bounce to fade)
- Trigger: Price recovers to $4,230–$4,260 pre-CPI on thin volume, then stalls and shows a rejection candle
- Targets: $4,172 (overnight low) → $4,097 (March structural low)
- Invalidation: Price holds above $4,300 with volume after CPI; reversal candle with confirmation
- No-trade condition: Do not initiate a short within 15 minutes of 8:30 AM ET release; let the initial CPI spike settle
Conditional long (Scenario C or D only — soft CPI required)
- Zone: $4,170–$4,200 (current area; only valid if CPI soft)
- Trigger: CPI core ≤+0.2% AND price breaks back above $4,210 with volume
- Targets: $4,260 → $4,320 → $4,366 (prior S/R)
- Invalidation: $4,165 closes on a 4H candle; or CPI comes in at or above consensus
- No-trade condition: Do not buy into a soft-CPI spike; wait for the retest
No-trade conditions (any scenario)
- CPI prints at exactly consensus — choppy bidirectional action; low-quality setups
- If overnight low of $4,172 is broken pre-CPI on further news, the structure is in free-fall; wait for a definable low
- Spread and volatility around 8:30 AM ET make stops unreliable; sizing should reflect that
Risk warnings
Main risk: CPI hot-print scenario. A headline of +0.7% or core of +0.5% would be the worst case for gold before the June FOMC. The market is not fully pricing this in at $4,188 — that print could push toward $4,097 in the session.
Fake-move risk: An in-line CPI print may produce a 30-minute relief bounce to $4,250–$4,280 that looks like a reversal. It's not — the trend structure is bearish. Without a genuine soft miss, any bounce before the FOMC (June 16–17) is likely a selling opportunity.
News risk: Iran-US military situation remains fluid. A ceasefire announcement removes the oil-inflation channel and could produce a sharp squeeze in gold. A further escalation (new strikes, Strait of Hormuz closure threat) initially pushes oil higher but gold lower, per the pattern observed all week.
Data as of approximately 07:00 ET, June 10, 2026. CPI has not yet been released. All forward-looking statements are estimates; no guaranteed-profit language. Confirmed price data separated from forecast scenarios above. Invalidation levels are pre-defined — honor them.
Fuentes de referencia
- 1Precious Metals Lower as Trump Vows Military Response — WSJ
- 2The great gold myth: Why the precious metal isn't the war hedge we're told it is — MarketWatch
- 3Live Gold Price Chart — Kitco
- 4Gold Continuous Contract GC00 — MarketWatch
- 5DXY US Dollar Index — Investing.com
- 6US 10-Year Treasury Yield — Investing.com
- 7Gold (XAU/USD) Price Forecast: Bearish Pressure Builds After Breakdown — FXEmpire
- 8Gold just had its worst selloff since March. A floor may be $4,000, says one veteran strategist — MarketWatch
- 9Gold and Silver Price Forecast: Metals Face Pressure Before CPI Data — FXEmpire
Añade más opiniones o contexto en torno a este contenido.